Events
Location: Main Menu > Monitor/Command > Events
The Events page displays live system activity in real time. It allows users to monitor access activity, review event details, and quickly navigate to related hardware.
Understanding the Events Grid
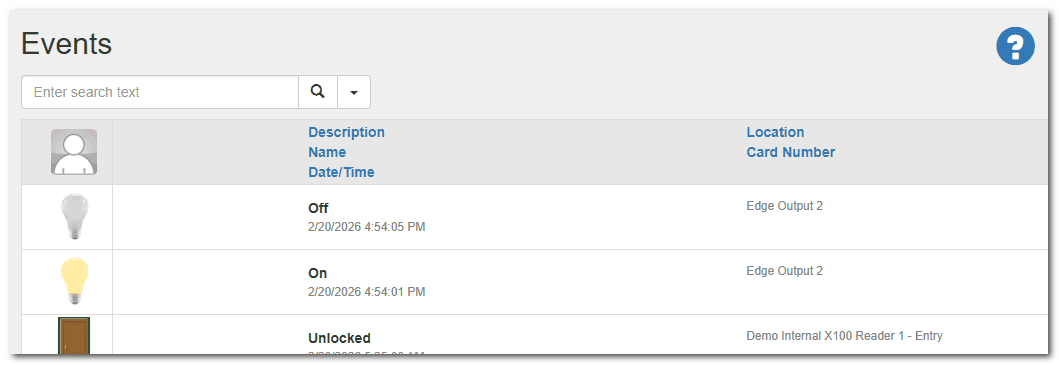
The Events grid contains sortable columns, typically including:
•Description – Type of event (e.g., Access Granted, Denied Invalid PIN)
•Name – Cardholder or device name associated with the event
•Date/Time – When the event occurred
•Location – Reader or door where the event occurred
•Card Number – Credential number used (if applicable)
Sorting Events
To change the sort order:
1.Click on any column header.
2.Click again to reverse the sort direction.
Note: Date/Time is the default and most commonly used sort option.

Event Grid
Viewing Event Details
To open the Event Details page, click directly on the event row.
From the Event Details page, you can:
•View the event status
•Command the associated device (if permitted by role)
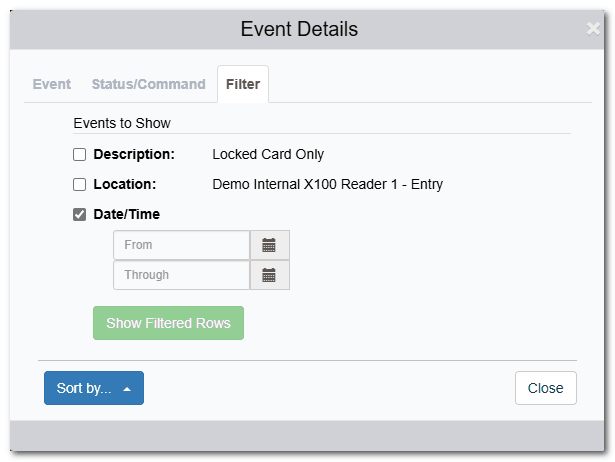
•Set or adjust event filters
•Navigate to the associated hardware details page
Live Monitoring

Event Filter
The Events page updates automatically and is commonly used by:
•Security personnel
•Guard stations
•System administrators
For a more visual, scrolling display of access events, use:
Main Menu > Monitor/Command > Visual Verification
Searching and Filtering Events
Use the Search Box (top of the page) to quickly locate specific events.
Search Modes
•Contains (default) – Finds records containing the search term.
•Begins With – Finds records starting with the search term.
•Ends With – Finds records ending with the search term.
To clear a search:
•Click the “X” next to the active search filter.
Tip: You can search by cardholder name, door name, card number, or event type.